In this post you’ll learn how to generate a Power BI cumulative sum report to visualize sales revenue through today’s date.
Cumulative Sum Report Preview
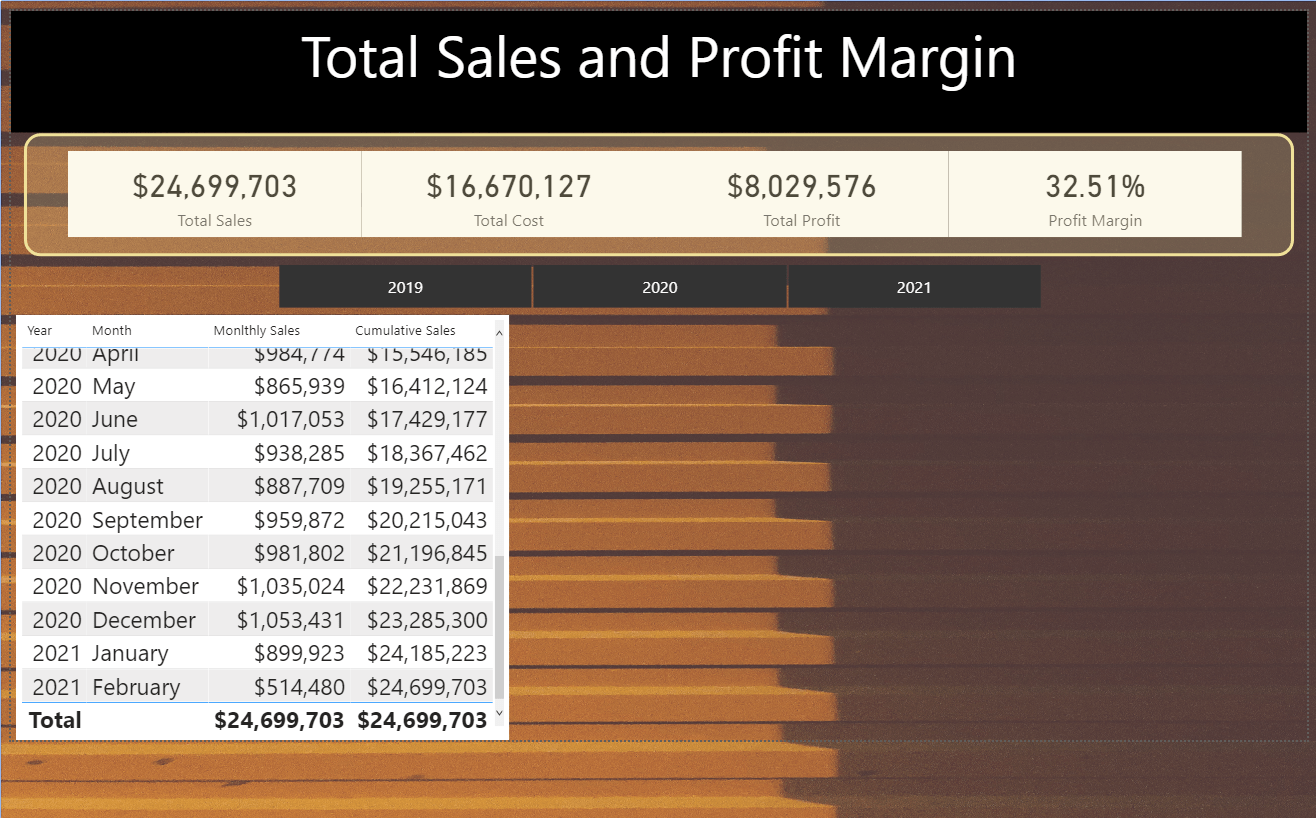
This example report continues from the previous post describing how to calculate profit margin.The report in the previous post looks as follows:

After this post, the report will have an updated title and newly added visual for viewing the running total.

Power BI Cumulative Sum DAX
The formula used for the Cumulative Sum is as follows:
MCumulativeSales =
CALCULATE([MTotalSales],
FILTER(ALLSELECTED(Dates_Data[Date]),
Dates_Data[Date] <= MAX(AllSales_Data[Order Date])))
This implementation addresses two requirements:
- It gives you a formula for calculating the running total; and
- It prevents you from displaying revenue values past dates of your recorded sales.
In many data setups, Power BI designers create a dates table that extends past the date of any recorded data. For example, a date’s table my contain dates through 2025 even though there are only recorded sales through February 2021.
Sometimes, this is not a problem, but what occurs with running totals is that the report ends-up showing empty rows and values. Take a look at the following:

There are only recorded sales through February 2021, but the rows for March 2021 and beyond are displayed.
This mistake has a tendency to creep into reports when doing the following:
MCumulativeSales =
CALCULATE([MTotalSales],
FILTER(ALLSELECTED(Dates_Data[Date]),
Dates_Data[Date] <= MAX(Dates_Data[Date])))
If you can’t see the difference, it’s on the last parameter. The first formula references the max dates of the sales table. However, the second formula references the max date of the primary dates table. Consequently, the date range for the cumulative sales extending beyond the range during which any sales have been made.
This is the what the Power BI cumulative sales totals look like when using the correct constraint:
Next Steps
In the next blog post, I’ll cover how I built the yearly date slicer. If the slicer’s Field depends on a date table which extends past the sale’s table order dates, then there will be similar behavior as seen with the original table in this post. That is dates will go beyond a useful selection..
Categories: Power BI
Leave a Reply